

In an era where precision and clarity are paramount, the integration of 3D mapping and digital site visualization is revolutionizing the landscape of project reporting. Gone are the days of static, two-dimensional diagrams that often leave stakeholders grappling with ambiguity.
Today, advanced technologies breathe life into data, transforming it into immersive visual narratives that capture the complexity of construction sites and urban planning projects alike. Imagine walking through a virtual build before the first brick is laid, or vividly observing the evolution of a project through each phase, with all nuances meticulously highlighted.
This dynamic approach not only streamlines communication but also enhances decision-making processes, allowing teams to visualize challenges and solutions in real time. As we delve into the myriad ways these innovative tools are reshaping project reports, we uncover the profound impact they have on accuracy, engagement, and overall project success.
The Importance of Accurate Project Reporting
Accurate project reporting serves as the backbone of effective project management, ensuring that all stakeholders have a clear understanding of progress, challenges, and financial health. In an era where information is pivotal, meticulously gathered data allows for real-time insights, enabling teams to pivot swiftly when unexpected issues arise.
A well-crafted report not only communicates milestones achieved but also highlights potential risks ahead, fostering a culture of transparency and accountability. In contrast, vague or misleading reports can lead to misinformed decisions, strained relationships, and costly delays.
By leveraging 3D mapping and digital site visualization, teams can enrich these reports with robust visual data, transforming complex metrics into intuitive graphics that bridge the gap between technical jargon and clear communication. Such enhancements not only bolster accuracy but also engage stakeholders at all levels, ensuring that everyone has a comprehensive and cohesive understanding of the projects trajectory.
How 3D Mapping Enhances Spatial Understanding
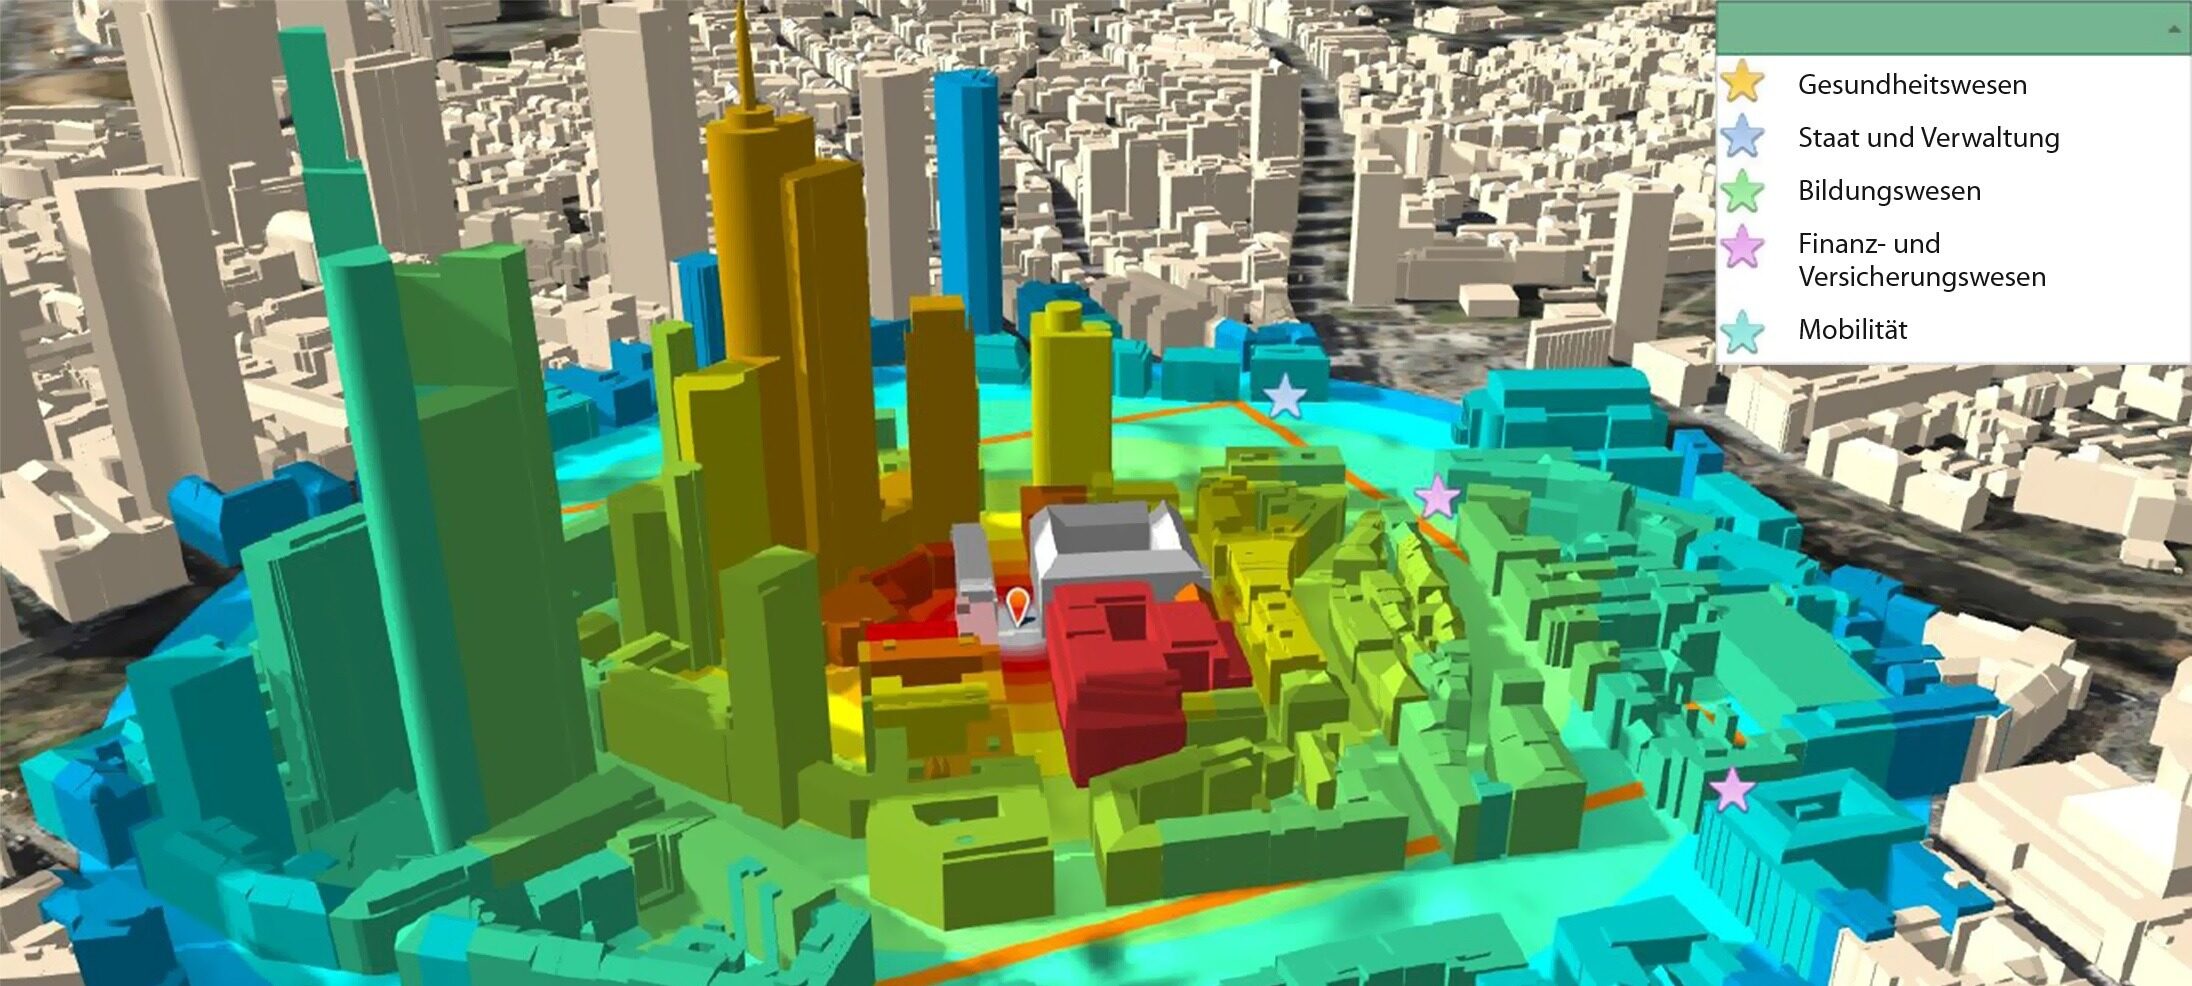
3D mapping revolutionizes the way we comprehend and interact with spatial data, offering a vivid, tangible representation of complex environments. Imagine witnessing a bustling cityscape unfold in three dimensions, where every building and street comes to life, revealing intricate relationships between elements that traditional 2D maps often obscure.
This immersive perspective not only enhances visual learning but also deepens our cognitive grasp of scale and context—transforming abstract figures into relatable visuals. As stakeholders navigate through layered topographies and intricate infrastructures, they gain insights that spark dialogue and foster collaboration, making decision-making not just an analytical process, but a shared experience enriched by a collective understanding of the spatial narrative.
In essence, 3D mapping becomes a powerful tool, bridging the gap between raw data and real-world implications, ensuring that every project report reflects not just numbers and statistics, but also the dynamic realities they encompass.
Conclusion
In conclusion, the integration of 3D mapping and digital site visualization technologies into project reporting represents a significant advancement in how data is communicated within the industry. By providing clear, immersive representations of project sites, these tools enhance stakeholder understanding, streamline decision-making processes, and ultimately lead to more efficient project management.
As industries continue to evolve, embracing innovative solutions like 3D mapping will be crucial to staying competitive. For those looking to explore further into the realm of visual technology, read more about mining photography to see how imagery can elevate project documentation and outcomes.